Uncovering the Biggest Waste in Manufacturing and How Startups Can Eliminate It
Manufacturing Waste Cost Calculator
Calculate Your Waste Costs
Estimate how much you're losing to overproduction waste and potential savings from lean implementation.
Results
Potential savings range: 0% - 45%
Current Overproduction Cost:
$0.00
Total Waste Cost (38% of operations):
$0.00
Potential Savings:
$0.00
Estimated ROI:
0%
Why this matters: Overproduction costs 38% of total waste-related costs for startups. Reducing excess inventory frees up capital for growth and prevents cash flow crises.
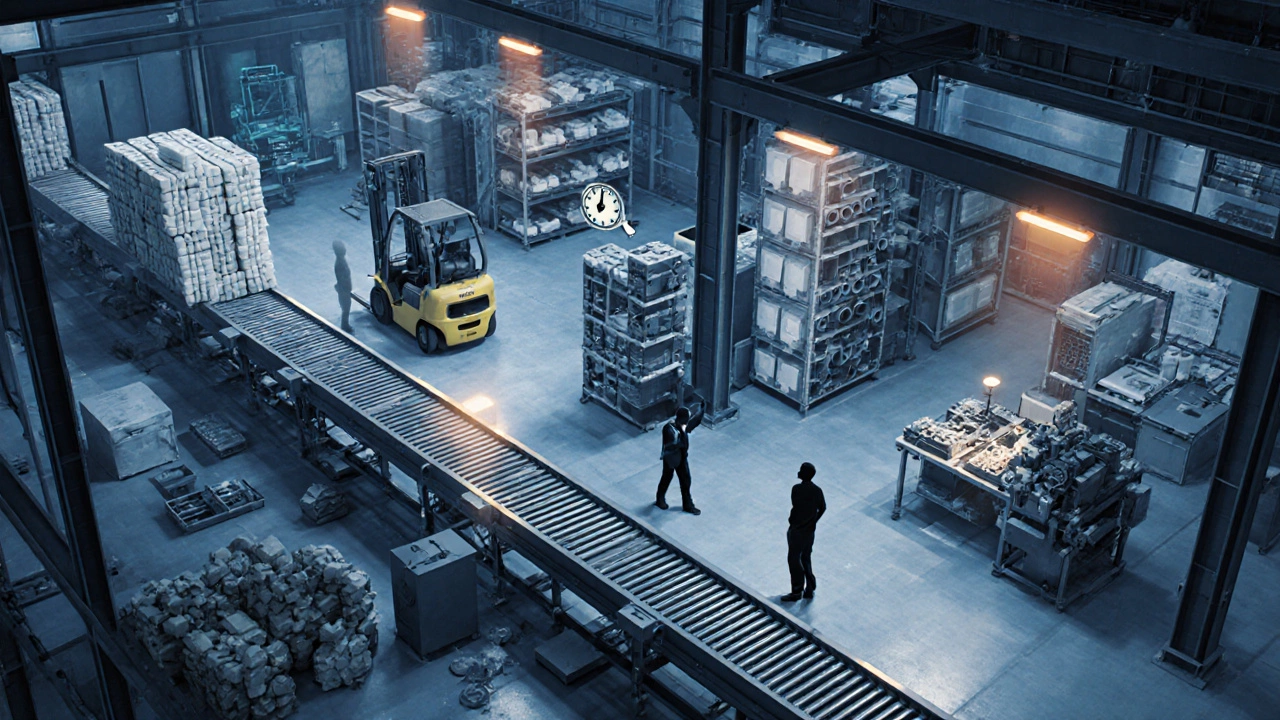
Every new manufacturing venture rushes to build capacity, but most founders overlook a silent profit‑killer that can cripple growth: waste. When you ask yourself, what is the biggest waste in manufacturing, the answer isn’t always obvious because waste shows up in many shapes-extra inventory, idle time, re‑work, you name it. This article breaks down the classic waste categories, pinpoints the one that typically hurts startups the most, and gives you a step‑by‑step playbook to shrink it fast.
What is Manufacturing Waste?
Manufacturing waste is any activity that consumes resources without adding value for the customer. In lean terminology it’s called Muda and is grouped into eight recognizable types. Understanding Muda is the first line of defense for any startup that wants to turn a lean operation into a competitive advantage.
The Eight Classic Types of Waste (Muda)
- Overproduction - making more than the next process needs or producing before a customer orders.
- Waiting - idle time while materials, information, or equipment are unavailable.
- Transportation - unnecessary movement of parts between locations.
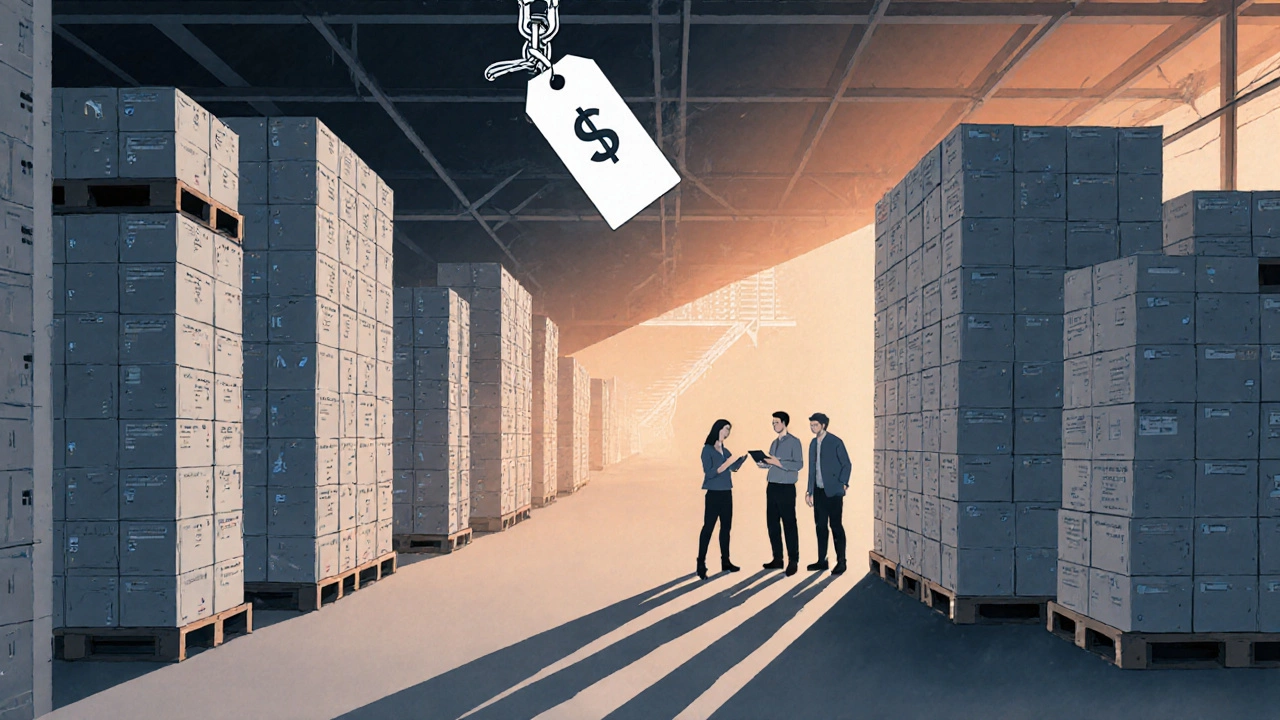
- Inventory - excess raw material, work‑in‑progress, or finished goods that tie up cash.
- Motion - extra movements by people (reaching, walking) that don’t add value.
- Defects - products that require rework, scrap, or warranty service.
- Overprocessing - more steps, features, or precision than the customer requires.
- Unused talent - not leveraging employee skills or ideas.
Each waste has a measurable cost, but they don’t all hit a startup equally. The next sections rank them by impact.
Why Overproduction Tops the List for Startups
Data from a 2024 survey of 150 early‑stage manufacturers showed that overproduction accounted for an average of 38 % of total waste‑related cost, dwarfing waiting (12 %) and defects (9 %). The reason is simple: new plants tend to over‑estimate demand to prove they can meet “future” orders, then end up with shelves of unsold stock.
Two real examples illustrate the point. A Sydney‑based electronics startup built 10,000 units of a smart‑sensor before securing a distributor contract; the inventory sat for six months, costing $250,000 in storage and capital. A small furniture maker in Melbourne produced 2,000 chairs per week, but the local market absorbed only 1,200, leading to a cash flow crunch that forced a temporary shutdown.
When cash is scarce, tying it up in idle inventory can be fatal. Overproduction also triggers a cascade of other wastes-extra transportation, higher defect rates from rushed quality checks, and more waiting as workers juggle surplus parts.
How to Spot the Biggest Waste in Your Operation
Identifying the dominant waste requires data, not just gut feeling. Here’s a quick audit you can run with a spreadsheet:
- List every process step and record cycle time, batch size, and changeover frequency.
- Calculate inventory value at each stage (raw material, WIP, finished goods).
- Track downtime causes (equipment breakdown, material shortage, operator idle).
- Measure defect rates and rework hours per product.
- Compute the cost of each waste type by multiplying time or quantity by labor and overhead rates.
The waste with the highest monetary value is your biggest culprit. For most startups, the spreadsheet will light up overproduction as the top line item.
Lean Manufacturing Tools to Trim Overproduction
Once you’ve confirmed that overproduction is the biggest waste, apply these proven lean tools:
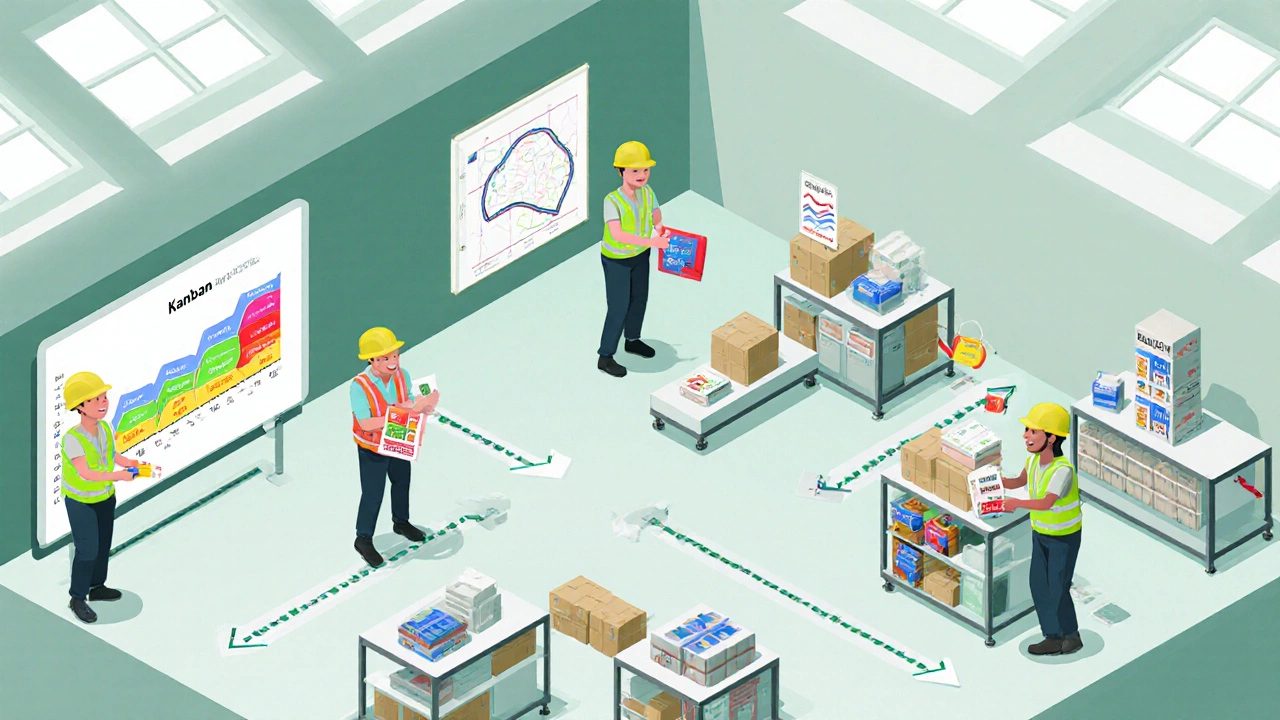
- Pull Systems (Kanban) - produce only when downstream demand signals a pull, preventing excess build‑up.
- Demand Forecasting - use short‑term sales data and statistical models (e.g., exponential smoothing) to set realistic production targets.
- Batch Size Reduction - smaller batches lower inventory and improve flexibility.
- Quick Changeover (SMED) - shorten setup time so you can run smaller batches without losing efficiency.
- Value Stream Mapping - visualize the flow, spot bottlenecks, and redesign the process to match actual demand.
These tactics belong to the broader philosophy of Lean manufacturing a systematic approach that eliminates waste, improves flow, and maximizes customer value. When applied early, they keep capital free for growth rather than sunk into unsold stock.
Case Study: A Startup That Cut Overproduction by 45 %
Eco‑Print, a sustainable packaging startup in Brisbane, launched with a 5,000‑unit monthly run of biodegradable trays. After a three‑month cash crunch, they ran the waste audit described above and discovered overproduction cost $120,000 per quarter.
They switched to a two‑stage Kanban: a visual board for raw material ordering and a digital signal for the packaging line. Coupled with weekly demand reviews, they trimmed batch sizes from 5,000 to 2,800 units. Within two months, inventory levels fell 45 %, storage costs dropped $30,000, and the freed cash was reinvested in R&D for a new compostable liner.
The takeaway? Even a modest shift from push to pull can free up half the working capital for a manufacturing startup.
Quick Checklist: Is Overproduction Your Biggest Waste?
- Do you regularly produce more units than confirmed orders?
- Is inventory turnover under 4 cycles per year?
- Are you experiencing storage fees that eat into profit margins?
- Do you have a Kanban or other pull system in place?
- Are demand forecasts regularly updated with real sales data?
If you answered “yes” to three or more, focus your improvement roadmap on reducing overproduction first.
Beyond Overproduction: Managing the Other Seven Wastes
While overproduction is often the biggest drain, the other seven wastes can quickly become secondary threats if ignored. Here’s a snapshot of how each can be tackled:
| Waste Type | Typical Impact | Lean Countermeasure |
|---|---|---|
| Waiting | Idle labor, delayed shipments | Balanced line staffing, preventive maintenance |
| Transportation | Higher handling costs | Cellular layout, point‑to‑point flow |
| Inventory | Capital tied up, obsolescence | Just‑in‑time delivery, supplier contracts |
| Motion | Ergonomic strain, time loss | Workstation redesign, 5S |
| Defects | Rework, warranty claims | Poka‑yoke, Six Sigma |
| Overprocessing | Unnecessary steps, higher cost | Value analysis, customer‑driven specs |
| Unused talent | Low morale, missed ideas | Kaizen workshops, cross‑training |
Addressing these wastes in tandem with overproduction creates a virtuous cycle of efficiency that keeps a startup agile and profitable.
Next Steps for Lean Startup Success
- Run the waste audit template on your shop floor.
- Identify the top‑cost waste (most likely overproduction).
- Implement a pull system and tighten demand forecasting.
- Measure the financial impact quarterly and adjust.
- Roll out targeted improvements for the remaining wastes.
Remember, waste elimination isn’t a one‑off project; it’s a continuous habit that fuels growth, especially when you’re scaling fast.
Frequently Asked Questions
Which waste typically costs the most for a new manufacturer?
Overproduction is usually the biggest cost driver because it locks up cash in unsold inventory and triggers several secondary wastes.
How can a small startup implement a Kanban system without expensive software?
Start with simple cards on a whiteboard: one column for ‘To Order’, one for ‘In Production’, and one for ‘Ready to Ship’. Move the cards as work progresses; the visual flow itself creates a pull system.
What KPI should I track to monitor waste reduction?
Inventory Turnover Ratio (cost of goods sold ÷ average inventory) and First‑Pass Yield (good units ÷ total units) are two fast‑feedback metrics that spotlight waste changes.
Can lean tools be applied in a high‑mix, low‑volume environment?
Yes. Techniques like SMED for quick changeovers and modular work‑cells help keep flow smooth even when product variety is high.
What’s the difference between waste and cost of goods sold?
COGS includes all direct expenses needed to make a product (materials, labor). Waste is any portion of those expenses that does not add value for the customer-essentially “extra” COGS that can be eliminated.

Recent Posts
-

Which Wood Is Strongest in India? A Guide for Furniture Manufacturers
-

How Many Plastic Companies Are There in the US? (2026 Industry Data)
-
Who Makes Steel for the US Military? Top Defense Suppliers and Domestic Plants
-

How Long Does Plastic Take to Disintegrate? A Timeline for Manufacturers
-

Cheapest Countries to Manufacture in 2026: A Guide for Startups