Top Plastic Manufacturers Generating the Most Waste in 2025
Plastic Waste Comparison Tool
Compare Top Plastic Manufacturers
Select companies to see waste generation and recycling performance data from 2024
Select Companies
Results
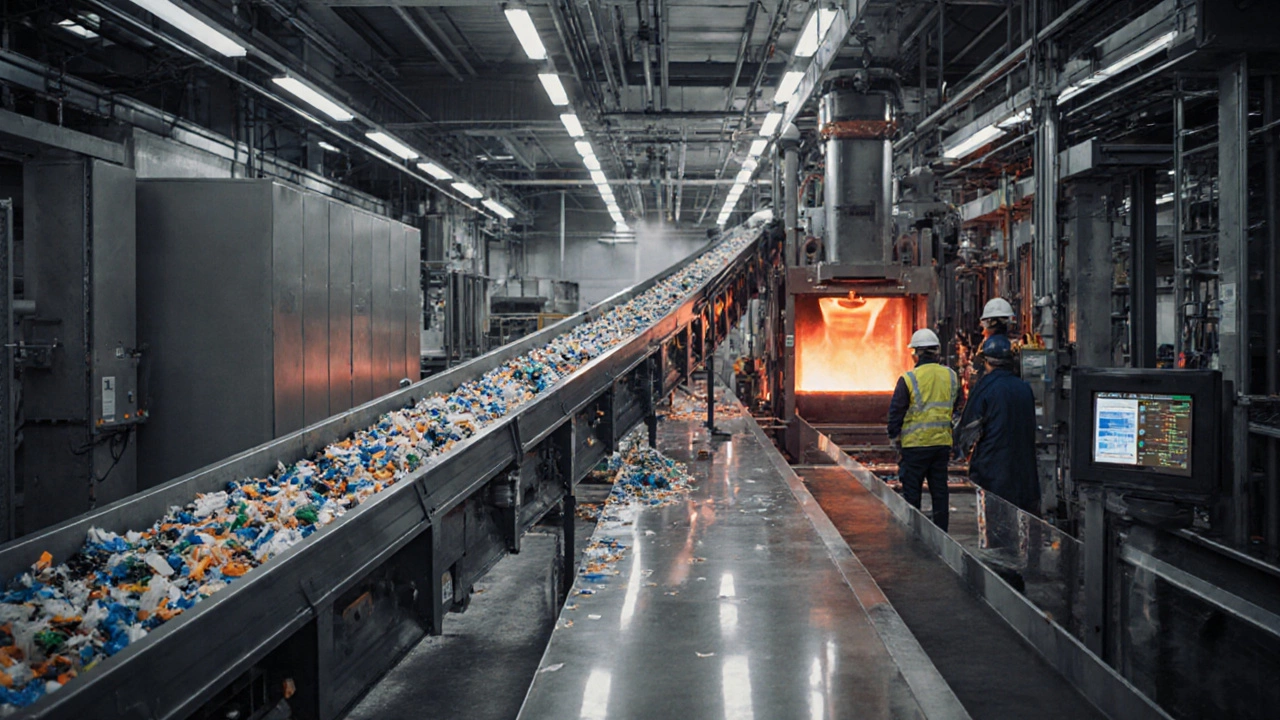
When you hear the phrase plastic waste, you probably picture litter on beaches or plastic bottles in a landfill. But the biggest chunk of that mess starts in factories, not in the curbside bin. Knowing which plastic manufacturing companies are the biggest waste generators helps you understand where change is most needed and which policies can hit the problem at its source.
Why corporate waste matters more than consumer litter
Consumers definitely add to the problem, but factories pump out millions of tons of polymer each year. A single production line can spew out enough plastic to fill a small stadium, and the leftover scraps, off‑spec material, and mis‑routed shipments often end up as waste. If a company can cut its waste by just 10%, that translates to hundreds of thousands of tons saved globally. So the real climate and marine‑health impact lies in the supply chain, not the shopping cart.
How we rank the biggest waste producers
We looked at three data points that are publicly reported or disclosed in sustainability reports for 2023‑2024:
- Volume of plastic waste generated on‑site (tons per year).
- Share of waste that is recycled or re‑used versus landfilled or incinerated.
- Corporate commitments to circular‑economy targets and how close they are to meeting them.
Cross‑checking these figures with Bloomberg's ESG database, the EPA’s toxic release inventory, and the companies’ own annual sustainability disclosures gave us a reliable picture of who’s leading the waste parade.
Top five plastic manufacturers by waste output
| Company | Annual Plastic Waste (tons) | Recycling Rate (%) | Key Waste‑Reduction Initiative |
|---|---|---|---|
| Dow Chemical | 1,850,000 | 23 | Closed‑loop resin recovery program |
| ExxonMobil | 1,620,000 | 19 | Carbon‑capture‑linked polymer redesign |
| BASF | 1,480,000 | 28 | Bio‑based feedstock substitution |
| LyondellBasell | 1,350,000 | 31 | Advanced catalyst recycling |
| Shell | 1,210,000 | 22 | Zero‑waste to landfill pledge by 2030 |
These five firms together account for roughly 7.5 million tons of plastic waste each year-about a third of the global industrial plastic waste stream.
What drives waste in these giants?
Each company’s waste profile is shaped by the type of polymer they focus on, the age of their plants, and how aggressively they’ve adopted newer technologies.
- PET (polyethylene terephthalate) is a staple for beverage bottles. Dow and BASF run massive PET lines, and when production hiccups happen, off‑spec resin piles up and gets scrapped.
- Polyethylene (PE) is the workhorse for films and bags. LyondellBasell’s PE plants, built in the 1990s, still generate a lot of trim waste that newer facilities have already minimized.
- High‑density polymer blends used in automotive parts (a segment where ExxonMobil has a big presence) often require specialty additives that are hard to recycle, leading to more landfill disposal.
Older equipment tends to be less precise, producing more off‑grade material that ends up as waste. Upgrading to state‑of‑the‑art reactors, better temperature control, and automated quality checks can shave 5‑10 % off waste volumes.
Regulatory pressure and voluntary frameworks
In Australia, the Australian Packaging Covenant pushes large producers to achieve 100 % recyclable packaging by 2025. Europe’s Extended Producer Responsibility (EPR) schemes levy fees based on the amount of non‑recycled plastic a company puts into the market.
Many of the top waste generators have signed up for these programs, but compliance varies. For example, Shell publicly committed to zero waste to landfill by 2030, yet its 2024 report still shows 78 % of waste ending up in incineration-because the definition of “landfill” excludes certain energy‑recovery facilities.
Success stories: How some players are cutting waste
Not all headlines are doom‑laden. BASF’s bio‑based feedstock shift reduced its PE waste by 12 % last year, while LyondellBasell’s advanced catalyst recycling program reclaimed 45 % of spent catalysts that previously went straight to landfill. Dow’s closed‑loop resin recovery system now takes enough scrap to produce 1.2 million tons of new polymer annually, effectively turning waste into raw material.
These wins show that when a company pairs a clear target with measurable metrics, waste can be cut dramatically. The common thread? Investing in technology, transparent reporting, and collaborating with third‑party recyclers.
What can governments and consumers do?
Policymakers can tighten EPR fees, mandate higher recycling rates, and fund retrofits for older plants. Consumers, on the other hand, can pressure brands by choosing products from companies that disclose real waste numbers and have credible reduction roadmaps.
One practical tip: look for the circular‑economy label on packaging. It signals that the manufacturer has committed to designing products for reuse, recycling, or safe biodegradation.
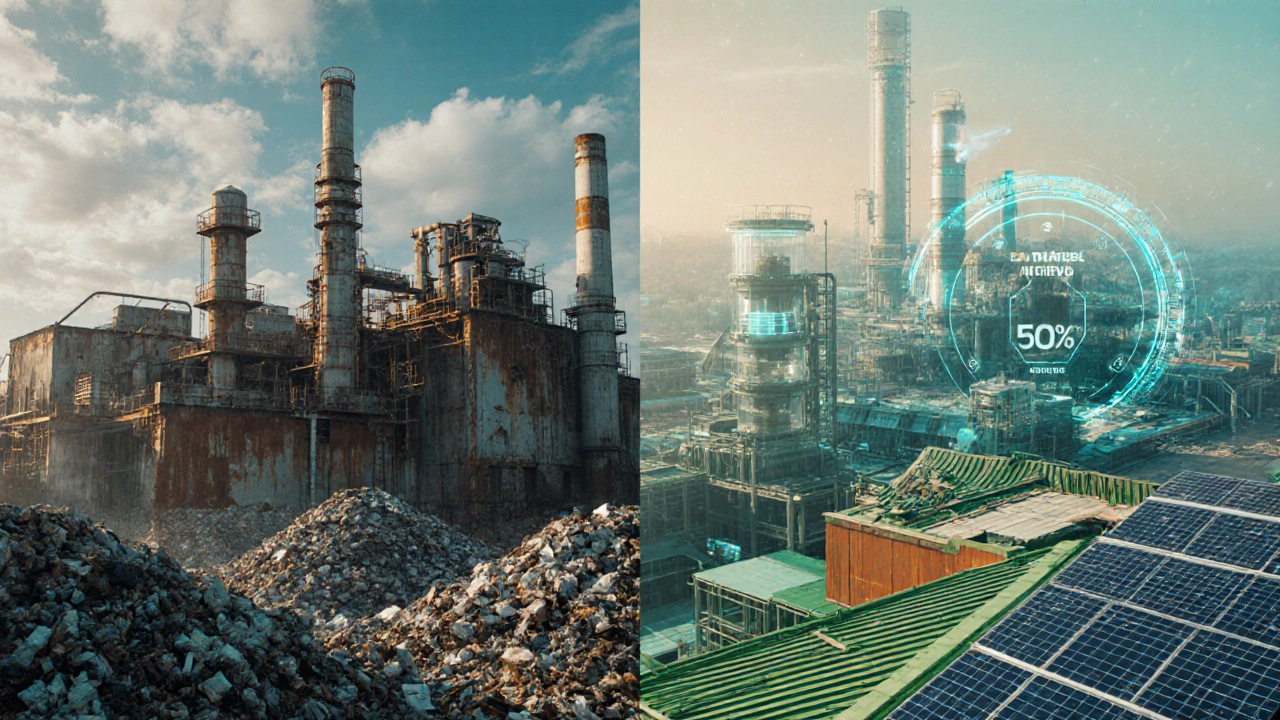
Future outlook: Toward a lower‑waste industry
By 2030, analysts predict that the top ten plastic manufacturers could collectively halve their waste output if they fully adopt circular‑economy principles and the necessary technology upgrades. The key will be transparent data, enforceable regulations, and market demand for recycled content.
So, the next time you toss a plastic bottle, remember that the biggest waste piles sit inside massive plants. Knowing which companies are responsible is the first step toward a cleaner supply chain.
Which plastic manufacturer generates the most waste?
According to 2024 data, Dow Chemical tops the list with about 1.85 million tons of plastic waste generated annually.
What types of plastic create the most waste?
Polyethylene (PE) and polyethylene terephthalate (PET) are responsible for the largest share of industrial waste because they are produced in the highest volumes and have many off‑spec by‑products.
How reliable are companies’ waste‑reporting figures?
Reporting quality varies. Companies that follow GRI or SASB standards tend to provide more audited, comparable numbers than those that only publish internal dashboards.
Can recycling really offset plastic waste from factories?
Recycling helps, but it’s not a silver bullet. Mechanical recycling can handle only certain grades, and down‑cycling reduces material quality. True waste reduction requires design‑for‑recycling and process improvements.
What role does the Australian Packaging Covenant play?
The Covenant sets targets for recyclability and recovery rates, and it holds signatories accountable through annual reporting. It has pushed several multinational producers to disclose and cut waste in their Australian operations.