India vs China: Which Country Offers Cheaper Manufacturing?
India vs China Manufacturing Cost Calculator
India
China
Cost Comparison Results
India
Total Monthly Cost: $0
Per Unit Cost: $0
China
Total Monthly Cost: $0
Per Unit Cost: $0
When a brand decides where to build a factory, the first question usually boils down to money:Is the destination truly cheaper? manufacturing cost comparison is more than a spreadsheet of wages; it’s a mix of labor, energy, land, logistics, taxes, and hidden risks. This article breaks down every major cost driver for India - a fast‑growing hub with a massive workforce - and China - the long‑standing world factory - so you can decide which one fits your product, timeline, and budget.
Key Takeaways
- Labor is roughly 30‑40% cheaper in India for low‑skill assembly, but China still leads in skilled automation wages.
- Energy costs favour India (about $0.07/kWh vs $0.09/kWh in China), yet reliability gaps can add backup expenses.
- Industrial land is up to 50% less expensive in Tier‑2 Indian cities; China’s coastal zones command premium prices.
- Port‑to‑factory logistics are shorter in China’s Pearl River Delta, but India’s expanding rail network is narrowing the gap.
- Regulatory incentives in India (tax holidays, duty exemptions) can offset higher compliance overhead, while China offers streamlined customs for high‑volume exporters.
Understanding Total Manufacturing Cost
Every manufacturer should start with a total landed cost model. That model adds up direct expenses (materials, labor, energy) and indirect costs (transport, tariffs, quality re‑work). The formula looks like this:
Total Cost = Labor + Energy + Land + Logistics + Taxes & Duties + Quality Adjustments + Risk Premium
Both India and China score differently on each term. Below we unpack the numbers that matter right now -2025 data from industry surveys, government reports, and major OEMs.
Labor Cost Comparison
Labor is the most visible cost driver. In 2024, the average monthly wage for a line‑worker in India’s textile and electronics sectors was Labor Cost - approximately$250USD per month for unskilled labor. In China, the same role averaged $400USD per month, a 60% premium. For skilled technicians, India’s average is $800USD versus China’s $1,200USD.
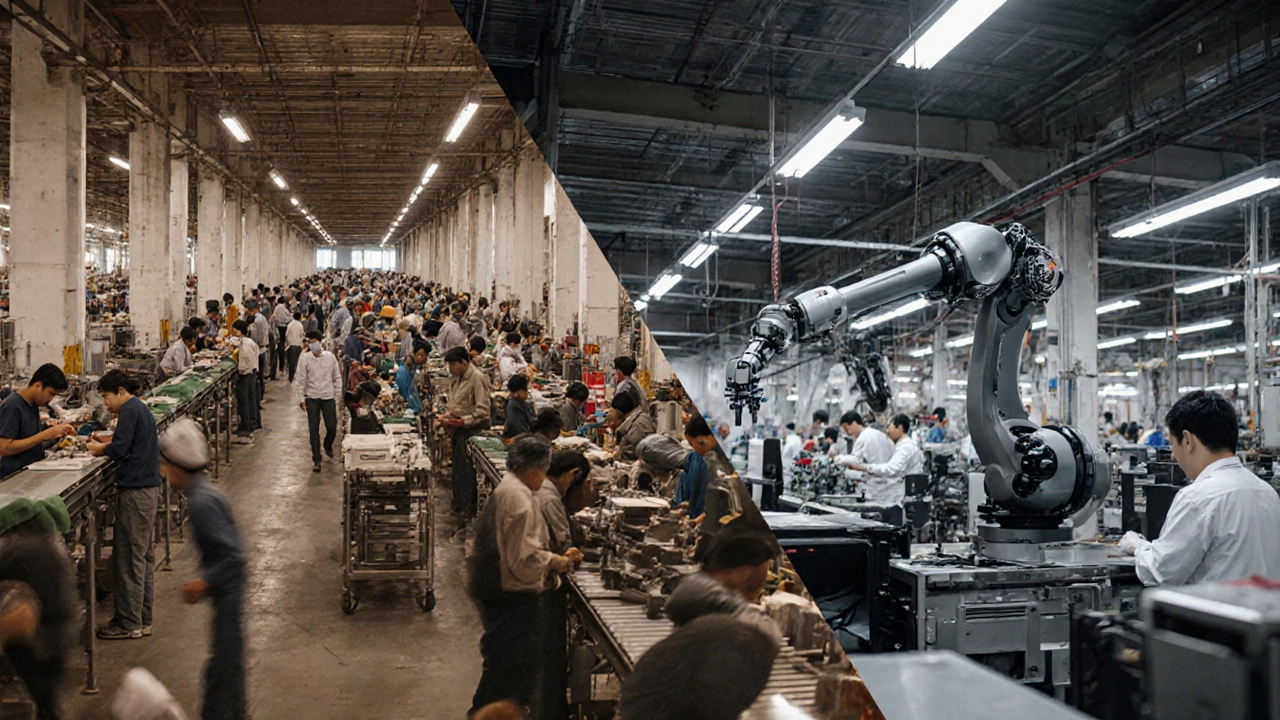
Why the gap? India’s younger labor pool and lower cost‑of‑living keep wages down, while China’s years of industrialisation have pushed salaries upward. However, productivity per worker is higher in China -roughly 1.4units produced per hour versus 1.1in India for similar tasks - meaning the wage gap can narrow when you factor in output.

Energy and Utilities
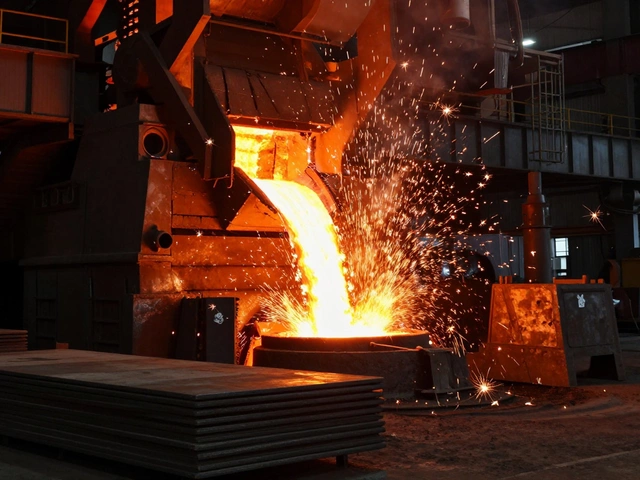
Running a plant 24/7 means power costs matter a lot. India’s average industrial electricity rate sits at $0.07perkWh, thanks to recent subsidies for manufacturing zones. China’s rate is $0.09perkWh, but the grid is far more stable. Indian factories often install diesel generators, adding $0.02‑$0.03perkWh extra during outages.
For energy‑intensive sectors -steel, chemicals, heavy electronics - the net difference can be $0.01‑$0.02perkWh, translating to $10‑$20million annually for a 200MW plant. For low‑energy products (apparel, consumer plastics), the impact is marginal.
Industrial Land and Facility Costs
Location within each country swings land prices dramatically. In India’s Tier‑2 cities like Bhubaneswar or Coimbatore, buying 10 acres for a manufacturing park costs $200‑$250USD per square meter. In China’s Tier‑2 hubs (e.g., Chengdu, Wuhan), the same land runs $350‑$450USD per square meter.
Coastal premium in China remains steep - a 5‑acre slot in Shanghai’s Songjiang district can exceed $600USD per square meter. Without a coastal need, Indian inland sites can be up to 50% cheaper, freeing capital for automation.
Logistics and Supply Chain
Getting raw material to the factory and finished goods to market is the next big chunk. China’s port infrastructure (Shanghai, Shenzhen) delivers world‑class turnaround times - average container dwell time under 2 days. India’s major ports (Mumbai, Chennai) average 4‑5 days, though the new Dedicated Freight Corridor (Delhi‑Kolkata) is cutting rail haul times by 30%.
Transportation costs per kilometer are similar ($0.15‑$0.20 for truck freight), but China’s higher load factor (fuller trucks) reduces per‑unit cost. For products targeting Asian markets, China still wins on speed; for products aimed at Europe or Africa, India’s lower customs duty on many textiles can compensate.
Regulatory Environment and Incentives
Both nations have overhauled their manufacturing policies in the last decade. India’s Regulatory Environment - offers 10‑year tax holidays for greenfield projects in Special Economic Zones, plus duty‑free import of capital equipment is attractive for new entrants. China’s “Made in China 2025” program gives subsidies for high‑tech equipment, but companies must meet stricter environmental standards.
Compliance costs in India can be higher because of state‑level approvals, but the process is becoming more digital. In China, the speed of approvals is faster, yet the paperwork for foreign ownership can be cumbersome, sometimes requiring a local joint‑venture partner.
Hidden Costs and Risk Factors
Beyond the headline numbers, a few hidden elements sway the total cost:
- Quality variance: China’s mature supplier ecosystems often deliver tighter tolerances, reducing scrap rates by 1‑2% compared to India.
- Currency volatility: The Indian rupee has appreciated 8% against the USD this year, narrowing the labor cost gap, while the yuan has been relatively stable.
- Political risk: Trade tensions with the US affect Chinese export duties; India’s non‑aligned stance offers more stable tariff regimes for Western buyers.
- Infrastructure reliability: Power cuts in parts of India add backup generator fuel costs, whereas China’s grid outages are rare but can cause sudden spikes in energy pricing during winter.
Decision Framework - When to Choose India or China
Use this quick matrix to match your product profile with the right country:
| Product Profile | Best Fit | Why |
|---|---|---|
| Low‑cost, high‑volume consumer goods (apparel, toys) | India | Cheaper labor and land outweigh slower logistics. |
| High‑precision electronics or automotive components | China | Higher skilled labor productivity and tighter supply chains. |
| Eco‑friendly or regulated products (pharma, chemicals) | Both - evaluate incentives. | India offers tax holidays; China offers mature compliance services. |
| Products targeting African or Middle‑East markets | India | Lower shipping distance from Indian west coast ports. |
Assess each factor against your margin targets. If you can absorb a 5% higher logistics cost for a 20% labor saving, India becomes the clear winner. Conversely, if time‑to‑market is a make‑or‑break factor, China’s port efficiency may justify the extra spend.
Bottom Line
Neither country is universally cheaper; the answer hinges on your product’s cost structure. For labor‑intensive, low‑margin items, India’s wage advantage and cheaper land typically deliver a 10‑15% overall cost reduction. For technology‑heavy, high‑margin goods where speed, quality, and supplier depth matter, China still edges ahead despite higher wages.
Build a detailed landed‑cost model, plug in your specific volumes, and run the numbers against the matrix above. The result will tell you which side of the Asia manufacturing divide offers the true savings for your business.
Frequently Asked Questions
Is labor cost the biggest factor in the cost difference?
Labor accounts for about 30‑40% of total manufacturing cost for most consumer goods. In India it’s 30‑40% cheaper, but higher productivity in China can offset part of that gap. The overall impact depends on how labor‑intensive your product is.
How do energy costs compare today?
India’s average industrial electricity price is around $0.07 per kWh, while China’s is about $0.09 per kWh. The gap narrows for low‑energy products but can add millions for energy‑heavy factories.
Are there any tax incentives for new factories?
India offers up to a 10‑year tax holiday for greenfield projects in Special Economic Zones, plus duty‑free import of capital equipment. China provides subsidies for high‑tech equipment under its “Made in China 2025” plan, but foreign firms often need a local partner to access them.
What hidden costs should I watch out for?
Consider quality scrap rates, currency fluctuations, backup power fuel, and compliance paperwork. In India, power outages can raise generator fuel costs; in China, stricter environmental rules may require extra treatment facilities.
Which country is better for exporting to Europe?
China’s faster port turnaround and established logistics network give it an edge for high‑value European shipments. However, India’s lower customs duties on many textiles can make it competitive for apparel if you can tolerate slightly longer transit times.